Three Views. One Dollar.
Finance sees a GL account, IT sees a Linux server, and the business asks what it costs to originate a loan — the same dollar in three languages. A working guide to the TBM Unified Model: the four-layer cost taxonomy, the allocation ladder that decides whether anyone believes your numbers, and the configure-versus-customize trap that quietly costs organizations their benchmark alignment.
By Tom Ward, Enterprise Architect — Cloud & Infrastructure
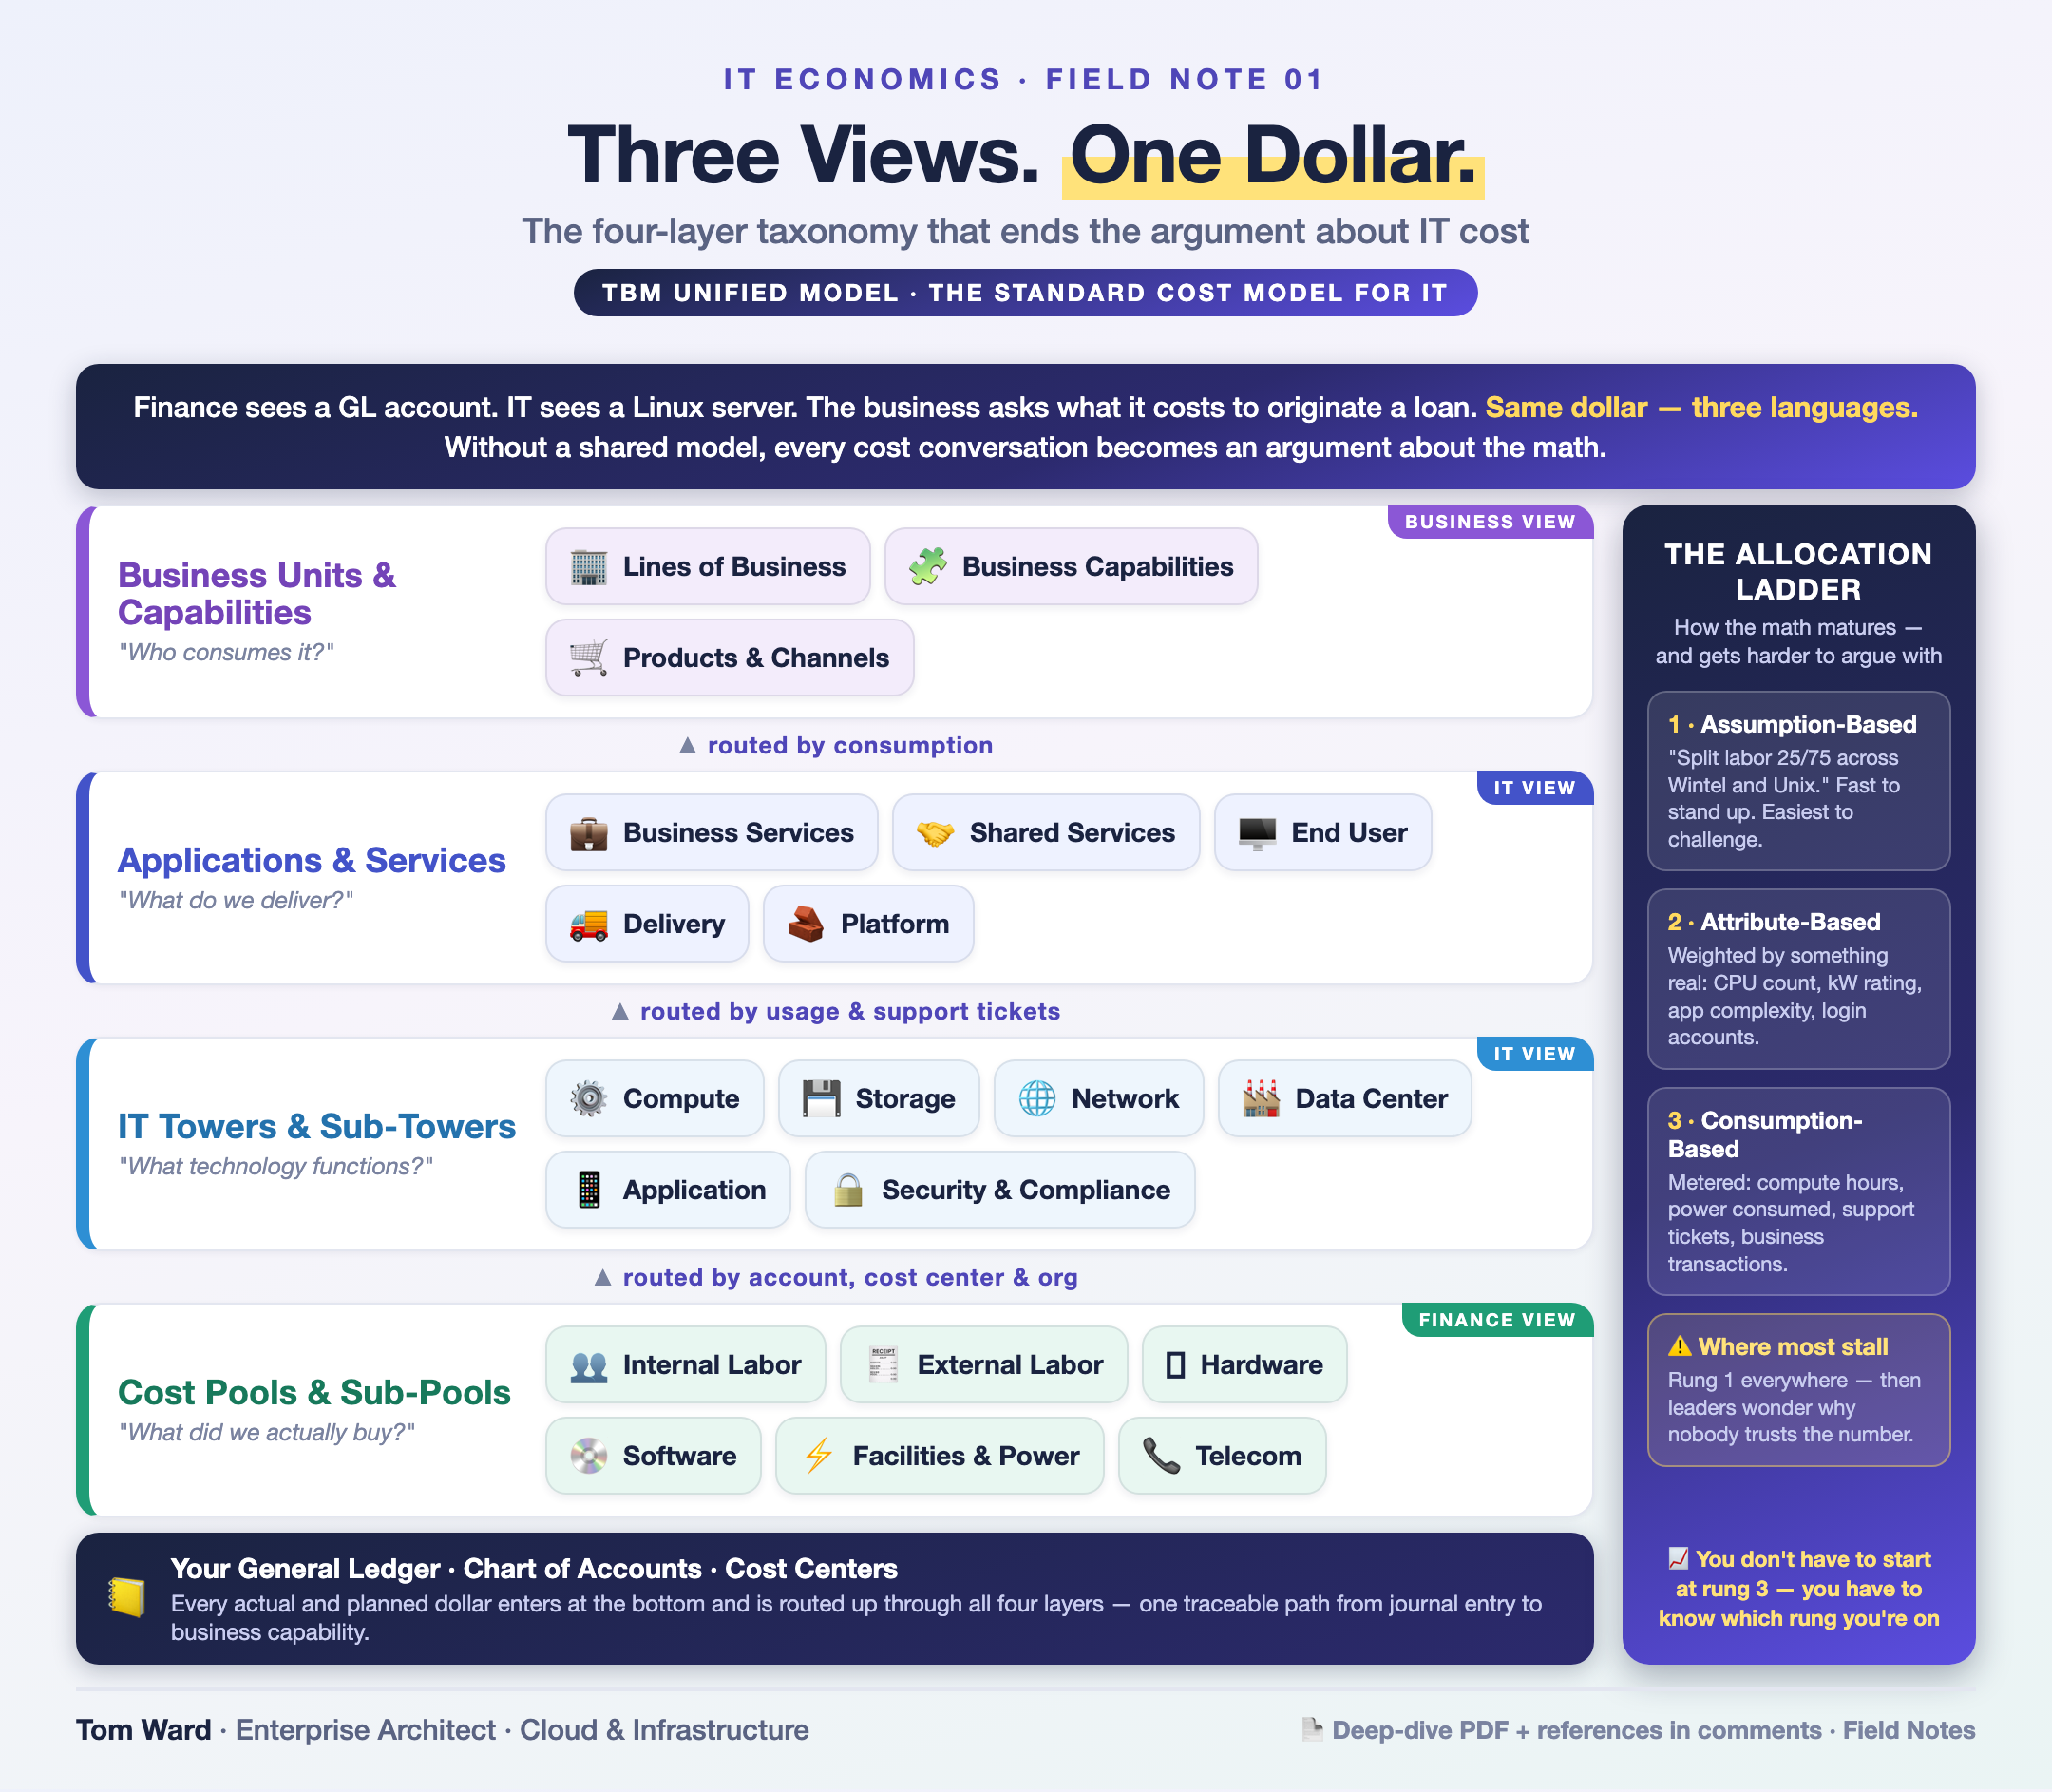
The four layers, bottom to top
Cost Pools & Sub-Pools
“What did we actually buy?”The bottom layer, closest to the ledger you already have. Costs land in a small set of pools — internal and external labor, outside services, hardware, software, facilities & power, telecom, internal services — each split into expense and capital sub-pools. This is the Finance view: terms a controller recognizes without translation. The value is in how specific the definitions are. The Hardware Expense sub-pool covers non-capitalized purchases — spare parts, consumables, equipment below the capitalization threshold — and nothing else. That precision is what stops two teams from booking the same cost in two places and calling both correct.
IT Towers & Sub-Towers
“What technology functions?”Where Finance's language becomes IT's. The standard towers — data center, compute, storage, network, platform, end user, application, delivery, security & compliance, IT management — describe technology functions rather than teams, and each breaks into concrete sub-towers. The Windows Compute sub-tower, for example, is everything associated with servers running Windows Server: hardware, software, labor, and support. That all-in framing is deliberate, because a unit cost is comparable to a peer's only if both sides agree what is inside the unit. It is also why this layer is where external benchmark data attaches.
Applications & Services
“What do we deliver?”The first layer a business partner recognizes without a translator. It separates business services — product management, sales & marketing, manufacturing & delivery, customer service — from shared services like finance, workforce, procurement, risk & compliance, and legal. Alongside them sit the IT-facing service groups: end user, delivery, platform, infrastructure, and emerging. That last one is worth noticing: “emerging” is where the taxonomy parks IoT, virtual reality, and blockchain — and where anyone building this model today will find themselves filing GPU capacity, model inference, and token spend.
Business Units & Capabilities
“Who consumes it?”The top layer, where the CFO's dollar finally has a name: originations, claims, fulfillment, a channel, a product line. The taxonomy allows two shapes — consuming business units and enabling business capabilities — and most organizations need both, because “who paid for it” and “what it enabled” are different questions. This is where TBM stops being a costing exercise and starts being a conversation about value: cost per employee by business unit, total cost to buy-build-run an application, the run-versus-innovation ratio, and the fixed-versus-variable split that determines how fast you could cut if you had to.
The allocation ladder
The taxonomy tells you which buckets exist. It does not tell you how a dollar moves between them — and that is where cost models lose their credibility. Three routing strategies are available at every hop. They are presented as options; they behave like a maturity ladder, because each rung is harder to argue with than the one below it.
- Rung 1
Assumption-based
Fastest, weakestCost is routed on a stated assumption — labor split 25/75 across Wintel and Unix compute, data center cost estimated from a $50/kW-month rate card, application support labor spread evenly, business application cost allocated across lines of business by percentage of revenue. It requires no new data, which is exactly why nearly every model starts here and why so many never leave.
- Rung 2
Attribute-based
Weighted by something realCost is weighted by an attribute of the thing itself — CPU count or kW power rating for a data center, make and model for a desktop, size or complexity for an application, number of assigned login accounts across lines of business. You are no longer asserting a split; you are deriving it from a property someone can independently verify.
- Rung 3
Consumption-based
Metered, hardest to disputeCost follows measured consumption — power actually consumed during the month, total compute hours per application, support tickets, business transactions. This is the rung where a business unit leader can change their bill by changing their behavior, which is the entire point of cost transparency. Rung 3 everywhere is a fantasy for most organizations; rung 1 everywhere is why nobody trusts the chargeback. The honest approach is a deliberate mix, and knowing which rung each allocation stands on.
The cost transparency baseline
Ten checks that separate a cost model people act on from a spreadsheet people dispute. Score one point per true statement. Below seven, fix the gaps before you publish a number to a business unit leader — you get one chance at that credibility.
- Every IT dollar has one path from the general ledger to a business unit or capability, and you can trace an individual cost end to end.
- The taxonomy is the standard one — you have configured within it rather than customized around it, and you can still compare to benchmark data.
- Each allocation's rung is known and documented — assumption, attribute, or consumption — and published alongside the number, not hidden behind it.
- The data sources are named and owned — GL, fixed assets, CMDB, PPM, HR, service desk — with a human accountable for each feed's accuracy.
- Cost pool mapping rules are written down, reviewed, and survive the departure of the analyst who wrote them.
- Application inventory and CMDB agree, or the discrepancy is a known, tracked, shrinking number.
- Unit costs are defined all-in — hardware, software, labor, and support — so a peer comparison compares the same thing.
- You can answer the four executive questions: cost per employee by business unit, total cost to buy-build-run an application, run versus innovation split, and forecast versus plan by cost pool.
- At least one allocation has climbed a rung in the last year, and the improvement was visible to the business unit it affected.
- Someone outside IT has challenged the model and the answer held up — a cost model that has never been contested has never been tested.
Going deeper
Sources worth your time, roughly in the order a team should read them.
- The TBM CouncilThe nonprofit standards body behind the taxonomy. Start here — it is the vendor-neutral home of the model.
- The TBM Taxonomy (current release)The four-layer model itself, maintained well past the 2020 white paper this note draws on.
- Learn TBM — practitioner resourcesThe Council's resource center: adoption guidance, case material, and vertical workgroup output.
- IBM — What is Technology Business ManagementA plain-language primer, useful for briefing an executive who has not met the discipline before.
- Apptio (now part of IBM)The vendor whose unified model this note analyzes — worth knowing the tooling even if you never buy it.
- Apptio resource libraryWhere the ATUM white paper and its companion material live.
- FinOps Foundation — the FrameworkTBM's cloud-era sibling. Same instinct, applied to spend that changes hourly rather than annually.
- What is FinOpsThe shortest path to understanding how cloud cost management relates to, and differs from, TBM.
More field notes ship as they're written.
Get the next note by email